
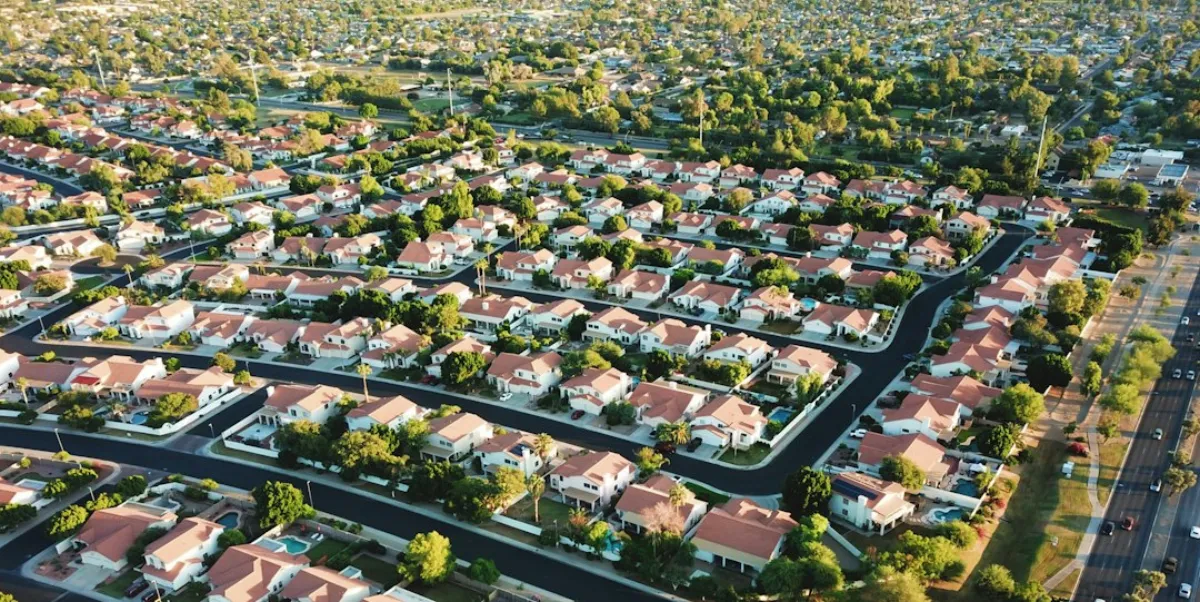
Every new home needs HVAC. The Census Bureau publishes exactly how many homes are being built in your target’s county — free, monthly, and almost no buyer checks it.
You’re looking at a company that did $1.8M last year. The seller says install revenue is strong. The P&L backs it up — new-construction installs accounted for 35% of total revenue in the trailing twelve months.
But here’s what the P&L doesn’t tell you: building permits in that county peaked two years ago and have dropped 33% since. The install pipeline is drying up. That $630K in new-construction revenue is a lagging indicator of a construction boom that already ended.
The seller knows this. The broker might know it too. The person who needs to know it — you — can find out in 10 minutes with free data from the U.S. Census Bureau.
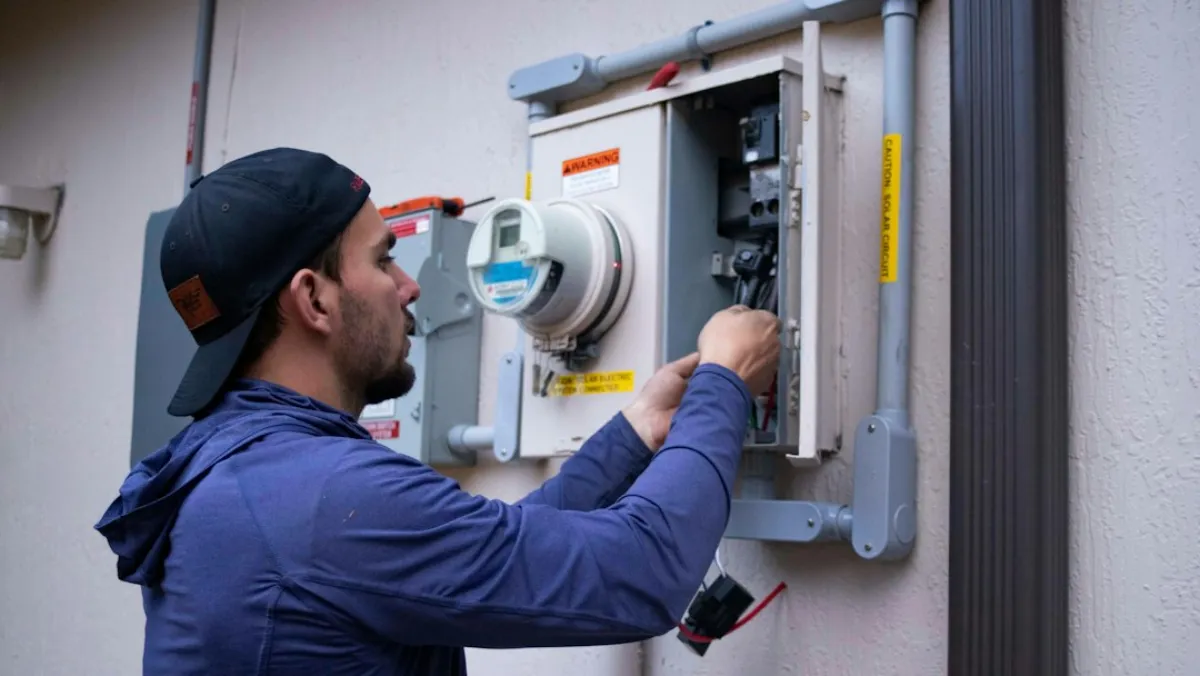
Building permits are the single best leading indicator of HVAC install demand. Every new home needs 1–3 HVAC units. Every unit is an $8,000–$15,000 installed job. And the Census Bureau’s Building Permits Survey publishes this data at the county and metro level, updated monthly.
This article shows you how to pull the data, read the trend, and run a sensitivity analysis that tells you what that permit trajectory means for the company’s revenue over the next five years.
Why Building Permits Matter More Than the Seller’s Revenue History
A seller’s trailing revenue is a photograph of the past. Building permits are a photograph of the future.
Here’s the mechanical relationship:
- A building permit gets pulled.
- 4–6 months later, framing is complete and the HVAC rough-in happens.
- 12–18 months after the permit, the HVAC trim-out and commissioning are done.
- The HVAC contractor invoices and collects.
So the install revenue you see on a 2025 P&L was largely driven by permits pulled in 2023–2024. If permits dropped 30% in 2025, that revenue decline hasn’t shown up in the financials yet — but it’s coming.
Each new single-family home typically means $8,000–$15,000 in HVAC installation revenue. That’s one furnace plus one AC unit in mild climates, or a furnace plus AC plus a zoned system or dual units in larger homes. Multi-family projects are lower margin per unit but higher volume — a 200-unit apartment complex can be a $400,000+ mechanical contract.
The National Association of Home Builders tracks builder confidence monthly. But builder confidence is a sentiment survey. Permits are commitments — someone paid fees, hired an architect, and filed plans with the county. Permits are money on the table.
A seller whose install revenue peaked in 2024 may have been riding the 2022–2023 permit surge. You’re not buying 2024 revenue. You’re buying 2026–2030 revenue. The permits tell you what that looks like.
How to Pull the Data in 10 Minutes
You don’t need a subscription, a data vendor, or an analyst. The Census Bureau gives this away.
Step 1: Go to the Building Permits Survey
Navigate to census.gov/construction/bps. This is the main page for the Building Permits Survey, run jointly by the Census Bureau and the Department of Housing and Urban Development.
Step 2: Find the county-level annual data
Click on “Data” in the left sidebar, then “County” under the geographic level options. You want the annual summary tables — they’re cleaner for trend analysis than the monthly data.
Select your target company’s county or MSA (Metropolitan Statistical Area). If the company serves multiple counties, pull each one.
Step 3: Download 5–7 years of data
Download annual single-family permit counts going back to at least 2019. You want to see:
- Pre-pandemic baseline (2019)
- Pandemic dip (2020)
- Pandemic boom (2021–2022)
- Rate-hike correction (2023–2024)
- Current trajectory (2025–2026)
Step 4: Record the numbers that matter
For each year, pull:
- Single-family permits — this is your bread and butter. Residential new construction is where most independent HVAC contractors make their install money.
- Multi-family permits (5+ units) — relevant if the target does commercial mechanical work or has GC relationships for apartment and condo projects.
- Total valuation — useful for understanding whether the homes being built are entry-level ($250K) or custom ($800K+). Higher-value homes mean larger, more complex HVAC systems and higher revenue per permit.
Put it in a spreadsheet. One row per year, columns for single-family count, multi-family count, and total valuation. Five minutes of work.
Reading the Trend — What the Numbers Actually Tell You
Raw permit counts are useful, but year-over-year percentage change is what actually informs your acquisition decision.
Calculate the YoY change
For each year, divide the current year’s permits by the prior year’s permits, subtract 1, and multiply by 100. That’s your percentage change.
Example: Declining market
| Year | Single-Family Permits | YoY Change |
|---|---|---|
| 2021 | 2,400 | — |
| 2022 | 2,600 | +8.3% |
| 2023 | 2,100 | -19.2% |
| 2024 | 1,800 | -14.3% |
| 2025 | 1,600 | -11.1% |
This county is down 33% from its 2022 peak. The install pipeline is contracting. If the company you’re buying gets 35% of revenue from new construction, that revenue is shrinking — and it will keep shrinking until permits stabilize or recover.
Example: Growing market
| Year | Single-Family Permits | YoY Change |
|---|---|---|
| 2021 | 800 | — |
| 2022 | 850 | +6.3% |
| 2023 | 900 | +5.9% |
| 2024 | 1,050 | +16.7% |
| 2025 | 1,200 | +14.3% |
This county is up 50% from 2021 and accelerating. The install pipeline is expanding. That doesn’t mean overpay — but it does mean the revenue trend has a tailwind behind it.
Compare to national trends
The Census Bureau publishes national totals alongside the county data. If national single-family permits are down 10% but your target’s county is down 30%, the local market is underperforming — and it’s not just a macro story. Something specific is happening: a major employer left, a builder pulled out, zoning tightened.
If the county is flat while the nation is down 10%, that’s actually a sign of relative strength.
The Bureau of Labor Statistics and Bureau of Economic Analysis can help you understand why a local market is diverging. Look at county-level employment data and GDP estimates. A county losing manufacturing jobs is losing the households that buy new homes.
Multi-family permits: different math
Multi-family permits (5+ units) follow different economics for HVAC contractors:
- Lower margin per unit. GCs negotiate hard on mechanical bids for large projects. You’re competing on price.
- Higher volume. A single project can keep a crew busy for months.
- Lumpy revenue. One 300-unit project can inflate a year’s revenue by $500K, then disappear.
- GC relationship dependency. If the target gets multi-family work through one or two general contractors, that’s concentration risk.
If the target does significant multi-family work, track those permits separately. A county with declining single-family but growing multi-family permits tells a very different story than one where both are falling. For more on how revenue mix affects what you should pay, see understanding the K-shaped market and revenue mix.
The Revenue Sensitivity Test
This is where the permit data becomes a dollar figure you can use in your offer.
Step 1: Get the revenue breakdown
Ask the seller — or better, calculate from the detailed financial statements — what percentage of revenue comes from:
- New construction installs (tied directly to building permits)
- Replacement installs (existing homes, aging equipment)
- Service and repair (maintenance agreements, emergency calls)
If the seller can’t or won’t break this out, that’s a red flag on its own. But you can estimate: pull the company’s install invoices for the last two years and categorize them by new-construction address vs. existing home. Your SBA lender’s underwriter will want this breakdown anyway.
Step 2: Apply the permit trend to new-construction revenue only
Replacement and service revenue are driven by the existing housing stock and customer demographics, not new permits. Isolate the new-construction revenue and stress-test it.
Step 3: Run the numbers
Worked example:
The target company does $1.8M in annual revenue:
- 35% from new construction = $630,000
- 40% from replacement = $720,000
- 25% from service/repair = $450,000
Permits in the county are down 30% from their peak and the decline is continuing. You model new-construction revenue declining proportionally:
| Year | New Construction | Replacement | Service | Total Revenue |
|---|---|---|---|---|
| Current | $630,000 | $720,000 | $450,000 | $1,800,000 |
| Year 1 | $535,000 | $735,000 | $460,000 | $1,730,000 |
| Year 2 | $440,000 | $750,000 | $470,000 | $1,660,000 |
| Year 3 | $400,000 | $770,000 | $485,000 | $1,655,000 |
New-construction revenue dropped $230,000. Replacement and service grew modestly (aging housing stock drives replacement demand, and a larger installed base drives service calls). But the net effect is a $145,000 revenue decline — about 8%.
What that means for SDE: If the company runs at a 20% SDE margin, that $145K revenue drop translates to roughly $50K–$70K less in SDE (depending on the variable cost structure of install work vs. service). If you’re paying 3x SDE, that’s $150K–$210K of overpayment built into an offer based on trailing numbers.
This is the core insight. The seller is pricing the business on peak revenue. The permit data shows you the revenue is declining. Your offer should reflect where the revenue is going, not where it was. For a deeper look at how to discount new-construction revenue in your valuation, see the new construction revenue valuation framework.
The critical threshold
If 60% or more of revenue comes from new construction and permits are declining, you are buying a company whose best days are behind it — at a price that assumes those days continue.
That doesn’t mean don’t buy. It means pay accordingly. And it means your post-acquisition plan needs to aggressively shift the revenue mix toward service agreements and replacement installs. Understanding the total addressable market in the service area will tell you how much replacement and service revenue is available to capture.
Three Warning Signs in the Permit Data
Beyond the overall trend, watch for these patterns.
1. Spike-and-crash
A county issues 3,000 permits in 2022, then drops to 1,200 by 2025. This usually means a large planned development — a master-planned community or a subdivision — built out and finished. That demand isn’t cyclical; it’s gone. The homes are built. Unless another large development is permitted (check the county planning commission minutes), you’re looking at a permanent step-down in install demand.
2. Flat for 3+ years
Permits hovering around the same number for several years — say 600–650 annually — signals a mature market. No growth tailwind, but no cliff either. In this scenario, the permit data is neutral. Focus your due diligence on the quality and durability of the service and replacement revenue instead. According to ACHR News, replacement cycles are shortening as equipment installed during the 2005–2008 housing boom reaches end-of-life — that’s a tailwind for your non-permit-dependent revenue.
3. One-developer dependency
Some counties have permit activity dominated by a single national builder — D.R. Horton, Lennar, NVR. If 60% of permits in the county come from one builder, and the HVAC company you’re buying is that builder’s preferred mechanical sub, you have two layers of concentration risk:
- The builder’s plans can change. They can pause a community, shift to a different market, or bring mechanical work in-house.
- The builder relationship may not transfer to a new owner. Builder relationships are often personal — the current owner golfs with the site super. When ownership changes, the builder re-bids.
Ask the seller to break out new-construction revenue by builder. If one name is 50%+ of new-construction installs, that’s customer concentration risk the aggregate permit data won’t show you.
What to Do With What You Find
The permit data doesn’t make your decision. It informs it.
If permits are growing
Good news — you have a demand tailwind. But don’t pay for revenue that hasn’t arrived yet. The seller didn’t earn that growth; the market provided it. Your offer should reflect trailing revenue with a modest adjustment for the visible pipeline, not a full projection of future growth.
If permits are declining
Discount the new-construction portion of revenue in your offer model. A company doing $2M with 40% new-construction revenue in a county where permits are down 35% is not a $2M company going forward. Model the decline, show it to the seller, and let the data make your case.
At the same time, model the partial offset: declining new construction often means the existing housing stock is aging, which drives replacement demand. That’s lower-margin work with longer sales cycles, but it’s more durable than builder relationships.
If permits are flat
Neutral — the permit data neither helps nor hurts. This is actually a fine place to be if you’re a first-time buyer. Predictable install demand, no cliff to worry about, no boom to overpay for. Focus on the service revenue quality and the replacement pipeline.
In every case
Ask the seller for one more thing: new-construction revenue broken out by builder.
The permit data tells you how many homes are being built. The builder breakdown tells you who is building them and whether the target company has the relationships to capture that work. If one builder represents 50%+ of new-construction revenue, you need to talk to that builder before you close — because that relationship is worth more than anything on the balance sheet, and it may not survive the sale.
The 10-Minute Version
If you take one thing from this article, do this before your next LOI:
- Go to census.gov/construction/bps.
- Pull single-family permits for the target’s county, last 5 years.
- Calculate the peak-to-current change.
- Ask the seller what percentage of revenue is new construction.
- Multiply that revenue by the permit decline (or growth).
- Adjust your offer accordingly.
Six steps. Ten minutes. It could be the difference between buying a company with a tailwind and buying one whose revenue is about to fall off a cliff — at a price that assumes the cliff isn’t there.