
The broker’s P&L is a highlight reel. The accounting file is the game tape. Here’s exactly what to look for inside that file before you spend $15K on a Quality of Earnings report.
The broker sent over the recast P&L. It looks clean. Revenue trending up, margins healthy, $180K in seller’s discretionary earnings. Nice round number. The kind of number that makes an SBA lender nod and an eager buyer start drafting an LOI.
But something feels off. Maybe the add-backs seem aggressive. Maybe the revenue jump in year three doesn’t match the truck count. Maybe you just have that gut feeling that comes from twenty years of walking into basements and knowing something’s wrong before you can name it.
Here’s what most first-time buyers don’t know: the broker’s P&L is a highlight reel. The actual accounting file — the QuickBooks backup, the Xero data, the FreshBooks export — is the game tape. And game tape doesn’t lie.
This guide shows you exactly what to look for inside that accounting file before you spend $15K on a formal Quality of Earnings report. This costs you nothing but time. And it might save you from buying a $600K problem.
What to Request (and Why Format Matters)
Don’t accept exported PDF reports. Don’t accept a “summary” spreadsheet the seller’s bookkeeper put together. You need the raw data.
For QuickBooks Desktop: Request the full backup file (.QBB). This contains every transaction, every deleted entry, every audit trail record since the file was created. The seller’s CPA can generate this in under two minutes: File > Back Up Company > Create Local Backup.
For QuickBooks Online: Request Accountant Access. This gives you read-only access to the live books — including the audit log that shows every change ever made. The seller invites you under Settings > Manage Users > Accounting Firms.
For Xero or FreshBooks: Request Advisor access or a full data export including transaction history.
Why this matters: exported reports only show what someone chose to show you. The backup file shows what they tried to hide.
The Audit Trail: Where Deleted History Lives
QuickBooks logs every single change. Every deleted invoice, every voided check, every transaction that was entered on March 15 but backdated to January 3. The software records who made the change, when they made it, and what the original entry looked like.
How to view it:
QuickBooks Desktop: Reports > Accountant & Taxes > Audit Trail
QuickBooks Online: Settings (gear icon) > Audit Log (QuickBooks documentation)
What to look for:
- Deleted invoices — A few per year is normal (duplicate entries, customer disputes). Dozens in a single month before listing the business? That’s revenue manipulation.
- Voided checks — Same logic. One or two voided checks per quarter is bookkeeping cleanup. A cluster of voided checks to a specific vendor right before the sale period starts is suspicious.
- Backdated entries — Transactions entered in October but dated to March. This shifts revenue or expenses between periods to smooth financials or inflate the trailing twelve months.
- Changes during the “marketing period” — The day the seller signed the listing agreement, the books should have frozen. If the audit trail shows heavy editing activity after that date, ask why.
A clean audit trail with minimal deletions tells you the books were kept honestly. A messy one with hundreds of changes in the year before listing tells you someone was polishing the numbers.
Journal Entries: Legitimate Adjustments vs. Red Flags
Journal entries are the accountant’s scalpel. In legitimate use, they handle year-end adjustments — depreciation, accruals, inventory corrections. Your CPA makes maybe 10–15 journal entries at year-end to true up the books.
Red flags:
- Mid-year reclassifications — An entry that moves $8,000 from “Owner Draws” to “Vehicle Expense” or “Subcontractor Costs” in June. This is someone reclassifying personal expenses to inflate deductible business expenses — which also inflates the appearance of legitimate business activity.
- Round-number entries — A $5,000 journal entry with a vague memo like “reclassification” or “correction.” Legitimate corrections reference specific invoices or transactions.
- Entries made by the owner (not the bookkeeper or CPA) — If the seller is making their own journal entries, they’re either very sophisticated or very creative. Check what they moved and where.
- Entries in the month before or after year-end that affect the trailing twelve months — This is the window where sellers adjust numbers to present the best add-back manipulation story.
How to find them:
QuickBooks Desktop: Reports > Accountant & Taxes > Journal
QuickBooks Online: Reports > Journal > filter by date range
Sort by amount (largest first) and read every entry over $2,000. It takes thirty minutes and tells you more than a two-page recast ever could.
Undeposited Funds: The Cash Handling Canary
“Undeposited Funds” in QuickBooks is a holding account. It represents payments received but not yet deposited at the bank. In a well-run operation, this account balance should be zero or close to it — payments come in, they get deposited within 1–3 business days.
What a problem looks like:
- A $15,000 balance sitting in Undeposited Funds for three months
- The balance growing over time rather than clearing regularly
- Large round-number entries sitting indefinitely
What this signals:
- Cash handling problems — Someone is collecting checks or cash and not depositing them promptly. In an HVAC operation with multiple techs collecting payments in the field, this could mean cash is walking out the door.
- Timing manipulation — Revenue is being held in limbo to shift it between reporting periods.
- Bookkeeping neglect — Nobody is reconciling. If they can’t reconcile Undeposited Funds, what else is wrong?
Check this account on the balance sheet as of the last three month-ends. If it’s consistently above $5,000 in a business doing $1.5M revenue, someone isn’t minding the store.
Class and Location Tracking: Profitability by Service Line
If the seller uses QuickBooks Classes, you’ve struck gold. Classes let you see profitability broken out by service line — residential replacement vs. commercial service agreements vs. new construction vs. maintenance plans.
Why this matters for HVAC buyers:
- Residential replacement typically runs 38–45% gross margin
- Commercial service contracts run 50–60% gross margin
- New construction runs 15–22% gross margin
A business doing $2M with 60% in new construction is a fundamentally different (and riskier) acquisition than one doing $2M with 60% in residential replacement. The recast P&L doesn’t tell you this. The class report does.
If they DON’T use classes:
That itself tells you something. A seller who never set up class tracking probably doesn’t know their profitability by service line. They can’t tell you which work makes money and which doesn’t. That’s not disqualifying — plenty of profitable HVAC shops run on instinct — but it means their SDE number is a blend of high-margin and low-margin work, and you won’t know the mix without deeper digging.
QuickBooks Desktop: Reports > Company & Financial > Profit & Loss by Class
QuickBooks Online: Reports > Profit and Loss > Customize > Group by Class
Vendor Payment Patterns: Reading the Cash Flow Story
Pull up the vendor payment history. You’re looking for patterns that reveal cash flow health — something the P&L won’t show you.
Healthy patterns:
- Payments to major suppliers (Carrier, Trane, Lennox, Goodman distributors) on regular 30-day cycles
- Consistent payment to the same core vendors month over month
- No late fees, no “payment plan” entries
Stress patterns:
- COD payments — If the seller is buying equipment COD (cash on delivery) instead of net-30 terms, their distributor pulled their credit. That means payment history problems you’ll inherit.
- Month-end clustering — All vendor payments hitting in the last 3 days of the month suggests the owner waits until receivables come in before paying bills. Classic cash flow stress.
- Late fees from suppliers — Check for charges from distributors labeled “finance charge” or “late fee.” Even $50/month in late fees tells you they’re stretching payables.
- Switching suppliers frequently — If they moved from Carrier to Goodman to Daikin in three years, they may be burning relationships (or chasing whoever will extend terms).
QuickBooks Desktop: Reports > Vendors & Payables > Transaction List by Vendor
QuickBooks Online: Reports > Expenses by Vendor Summary, then drill into each major vendor
Payroll Details: The Workforce X-Ray
Payroll records reveal the actual workforce structure — not what the seller tells you, but what the numbers prove. This matters because SBA lenders review these records to verify the business can sustain debt service with its existing workforce.
What to count:
- W-2 employees vs. 1099 contractors — An HVAC company with 4 W-2 employees and 12 1099 “contractors” has a 1099 misclassification risk that could cost you $100K+ in back taxes, penalties, and benefits. The IRS is clear on this: if you control when, where, and how someone works, they’re an employee.
- Seasonal patterns — Do they add 3 installers every May and lay them off in October? That’s normal for a replacement-heavy business but creates unemployment insurance cost spikes.
- Overtime concentration — Is one tech logging 25 hours of OT every week? That person is either indispensable (key-man risk) or committing time fraud.
- Family on payroll — The owner’s wife as “office manager” at $65K is a common add-back. But check if she actually does the work. If she does dispatch, AR, and scheduling, you’ll need to replace her at market rate — $45–55K plus benefits.
Where to find it:
QuickBooks Desktop: Reports > Employees & Payroll > Payroll Summary
QuickBooks Online: Reports > Payroll Summary (or check the payroll service reports if using external payroll)
Cross-reference the W-2 count against the tax returns you’re reviewing. They should match. If the QuickBooks payroll shows 8 employees but the 941 filings show 6, someone’s getting paid off the books.
The “Other Income/Expense” Dump
Open the P&L detail and scroll to “Other Income” and “Other Expense.” This is where sellers park items they want to exclude from operating income — making SDE look higher without technically lying.
Common items hidden here:
- Equipment sale proceeds — Sold a used truck for $18,000 and parked it in “Other Income” so it doesn’t inflate revenue (but the broker may still add it back to SDE)
- Insurance claim payouts — A $12,000 insurance settlement after a truck accident. One-time event, legitimate add-back. But was the claim itself a red flag?
- PPP loan forgiveness — Still showing up in 2022–2023 books. Absolutely should be excluded from normalized earnings, but check that it’s not being double-counted.
- Interest income from owner loans — The seller loaned the company $50K and charges it interest. That “expense” gets added back, but the loan itself may be a liability you’re assuming.
The fix is simple: read every line item in Other Income and Other Expense for all three years under review. Each one has a story. Make the seller tell you that story.
Chart of Accounts: The Organizational IQ Test
Pull up the Chart of Accounts (Lists > Chart of Accounts in Desktop, or Settings > Chart of Accounts in Online). The structure tells you how the business thinks about itself.
Signs of a well-managed operation:
- 40–80 accounts, logically organized
- Clear naming conventions (“Vehicle Fuel,” “Vehicle Maintenance,” “Vehicle Insurance” — not “Auto Stuff”)
- Sub-accounts that break out meaningful categories
- Accounts that match industry standards (ACCA benchmarking categories, for instance)
Signs of chaos:
- 200+ accounts with names like “Misc2,” “Old Account DO NOT USE,” or “Ask Jim”
- Multiple accounts that clearly overlap (“Supplies,” “Materials,” “Parts,” “Inventory Purchases” — all used interchangeably)
- Accounts created mid-year that duplicate existing categories (this often signals a bookkeeper changeover)
- Inactive accounts with large historical balances that were never properly closed
A messy COA doesn’t mean the business is bad. It means the books are unreliable and your QoE will cost more because the analyst has to untangle everything. Budget accordingly.
Five Specific Red Flags (With Examples)
1. The Revenue Cliff After Owner’s Vacation
The seller took three weeks off in July. Revenue dropped 60% that month. This tells you the owner IS the business — key-man risk at its clearest. If revenue doesn’t recover quickly after the owner returns, the customer relationships are personal, not institutional.
2. The Q4 Expense Reclassification
In November (two months before year-end), $23,000 in entries move from “Owner’s Draw” to “Subcontractor Labor.” This inflates COGS, reduces net income for tax purposes, but on the recast P&L the seller adds back the “excess owner compensation.” The net effect: SDE looks $23K higher than reality because the personal expenses are now hidden inside legitimate-looking cost categories.
3. The Disappearing Customer
Your largest commercial customer (a property management company paying $8,000/month) stops showing up in receivables in month 10 of the trailing twelve. Nobody mentioned they left. The P&L still looks fine because residential picked up — but you’re buying a business that just lost its anchor client.
4. The Payroll Timing Shift
In January (start of the trailing twelve months), the seller switched from bi-weekly to semi-monthly payroll. This created a one-time “extra” pay period in December (the prior year) and one fewer pay period in the current year. The impact: payroll expense for the year under review is understated by one pay cycle — roughly $15–20K for a 6-person crew. The P&L looks leaner than reality.
5. The Inventory Build Before Sale
Inventory on the balance sheet jumped from $35K to $85K in the six months before listing. The seller is stockpiling equipment they’ll include in the sale price — but they bought it on credit. You’re paying acquisition price based on inflated assets while inheriting the accounts payable that funded them. Check that inventory is valued at cost (not retail) and that corresponding AP is reflected in the working capital adjustment.
Your Pre-QoE Accounting File Checklist
Before you write that $15,000 check for a Quality of Earnings report — or before you walk away from one that’s clearly not needed — spend four hours with the accounting file. Here’s your checklist:
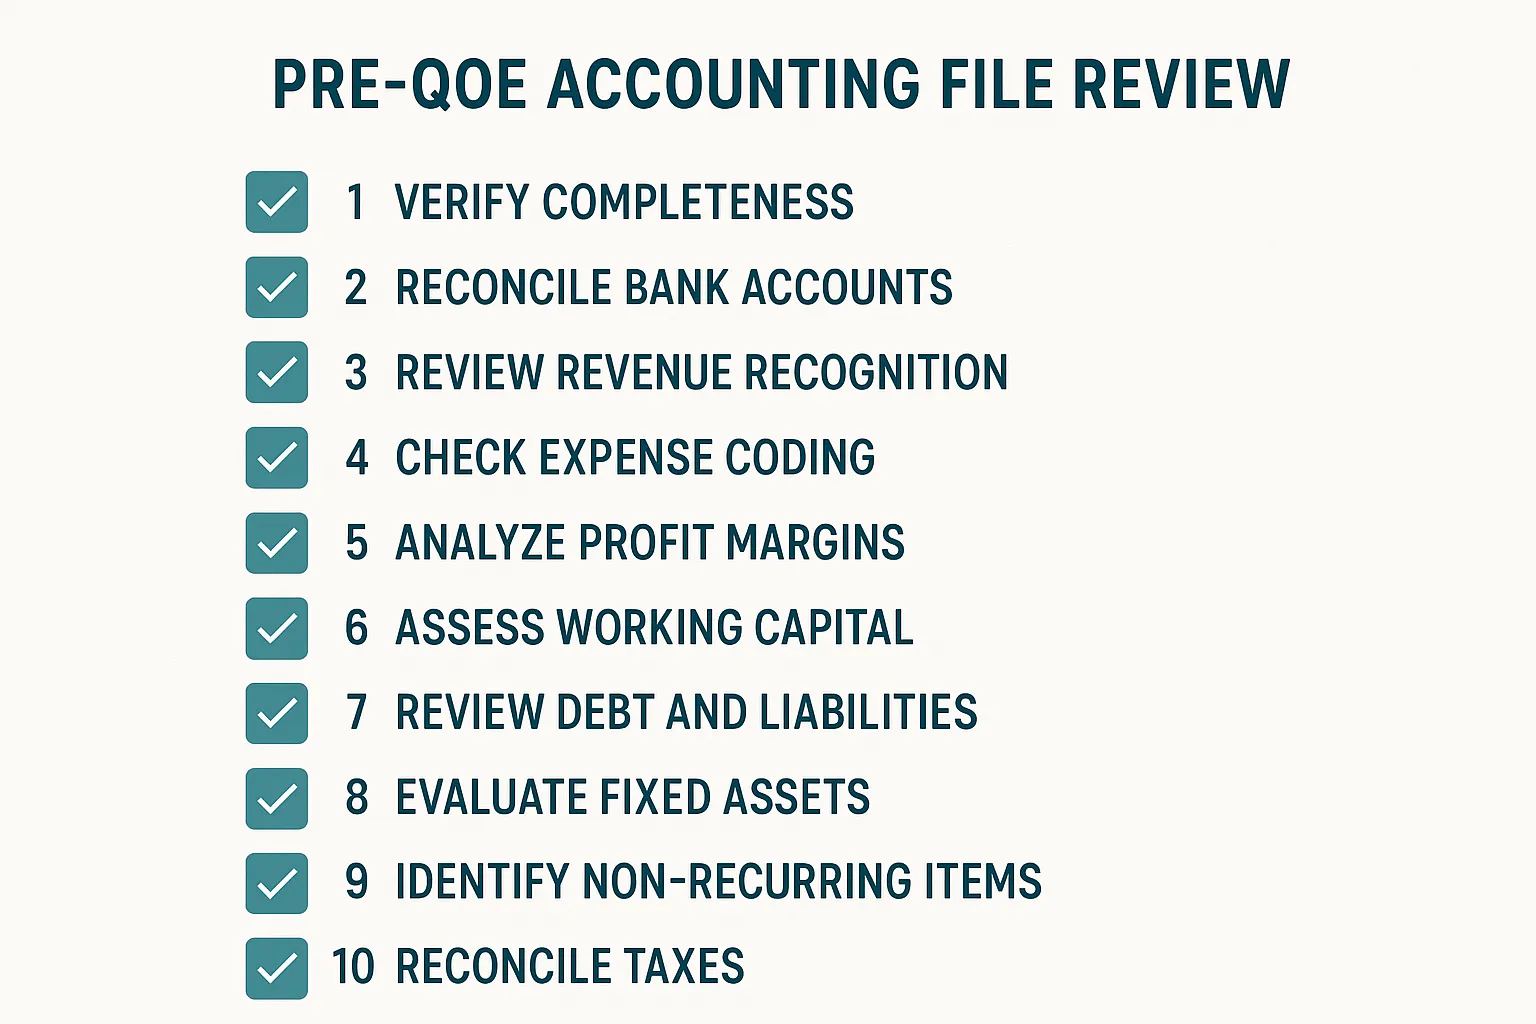
- Request the right file — .QBB backup or Accountant Access. Not PDFs, not spreadsheets.
- Run the audit trail — Look for deletions, voids, and backdated entries. Flag anything in the 12 months before listing.
- Read every journal entry over $2,000 — Note who made it, when, and what moved where.
- Check Undeposited Funds balance — Pull the balance for the last 6 month-ends. Should be near zero.
- Pull the P&L by Class — If classes exist, understand your revenue mix. If they don’t exist, plan for discovery.
- Review vendor payment timing — Are they on terms or COD? Any late fees?
- Count heads in payroll — W-2 vs. 1099, seasonal patterns, family members, overtime concentration.
- Read every Other Income/Expense line — Make the seller explain each one.
- Evaluate the Chart of Accounts — Clean and organized, or 200 accounts of chaos?
- Cross-reference against the P&L you were given — Do the numbers match? They should be identical. If they’re not, ask why the broker’s version is different from the source data.
The Bottom Line
This analysis costs you nothing but a Saturday afternoon. You’re not hiring anyone. You’re not buying software. You’re looking at data the seller should be providing anyway — you’re just looking at it with informed eyes.
If your financial literacy crash course taught you to read a P&L, this teaches you to read the story behind it. The summary P&L is the seller’s version of events. The accounting file is the unedited footage.
If everything checks out? Great — you’ve got confidence to move forward, and your QoE analyst will confirm what you already know (faster and cheaper, because you’ll tell them exactly where to look). If it doesn’t check out? You just saved yourself $15K in QoE fees on a deal that was never going to close.
Either way, you win. And that’s how you buy smart.
This guide pairs directly with the financial literacy crash course — if you haven’t read it yet, start there for the foundation. For the next level of financial scrutiny, a Quality of Earnings report takes what you’ve found here and puts a CPA’s stamp on it. And if the books reveal workforce red flags, the 1099 misclassification guide shows you exactly what that exposure costs.


